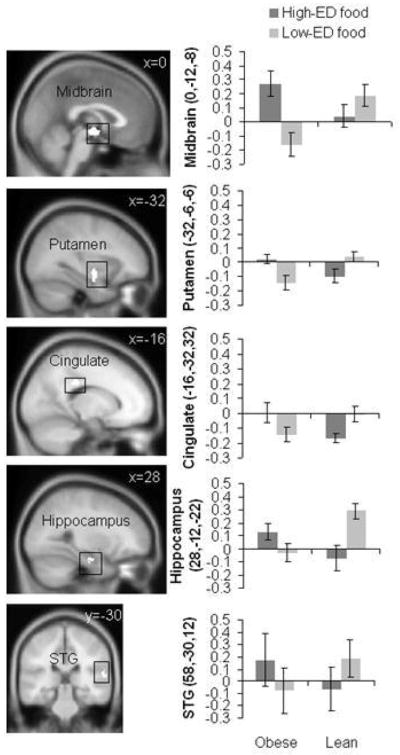
Figure 9. Brain activation in response to low and high ED food cues in lean and obese participants.

Sagittal and coronal brain slices depict areas showing greater visual and auditory activation (conjunction) in response to high-ED (vs. low-ED) food cues in obese vs. lean individuals in the midbrain (x = 0), putamen (x = −32), posterior cingulate gyrus (x = −16), hippocampus (x = 28), and superior temporal gyrus (STG, y = −30). Bar graphs show parameter estimates for voxels of each region in obese and lean individuals for high-ED and low-ED cues (mean ± SD). Reproduced from: “Greater activation and functional connectivity with midbrain in response to auditory and visual high energy density food cues in obesity,” by Carnell, S., Benson, L., Pantazatos, S. P., Hirsch, J., & Gelibeter, A. (2013). Unpublished manuscript, no permission required.
