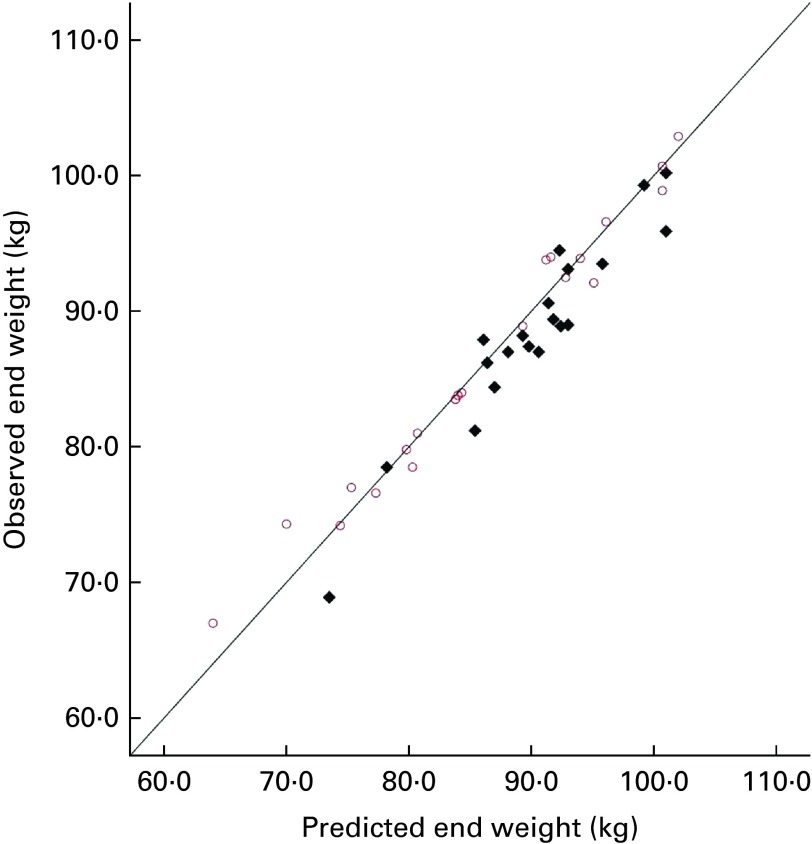
Fig. 1.
Predicted body weight (National Institute of Diabetes and Digestive
and Kidney Diseases (NIDDK) model) and observed weight at the end of
the experiment. Drinks given over 28 d:  , sucrose;
  , aspartame. (A
colour version of this figure can be found online at http://www.journals.cambridge.org/bjn)

