
Figure 2.
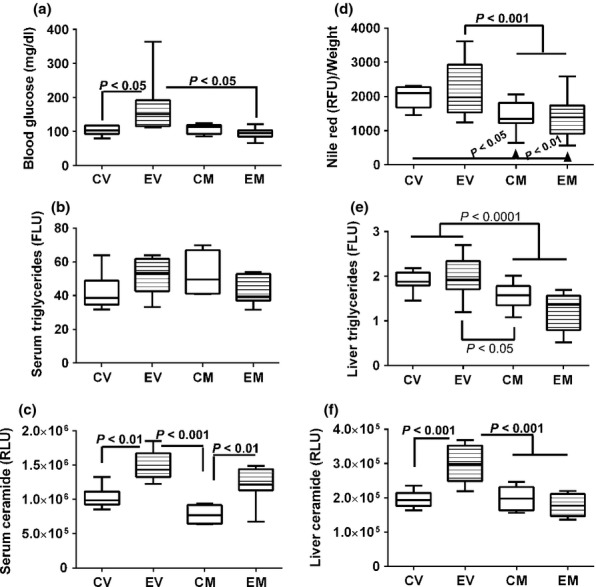
Effects of chronic ethanol feeding and myriocin treatment on fasting blood glucose, and serum and hepatic lipids. (a) Blood glucose levels were measured with a glucometer (b) Nile red fluorescence was measured in liver tissue homogenates and normalized to protein content. (b, e) Triglycerides were measured in (b) serum and (e) liver lipid extracts using a commercial assay kit (FLU, fluorescence light units). Liver tissue results were normalized to sample weight. (d) Nile red fluorescence assay was used to measure hepatic neutral lipids in protein homogenates. Results were normalized to sample weight (RFU, relative fluorescence units). (c and f) Serum and hepatic ceramide levels were measured by ELISA with luminescence detection (RLU, relative light units). Data were generated from 10 to 12 rats per group. Box plots depict medians (horizontal bars), 95% confidence intervals (upper and lower limits of boxes), and ranges (stems). Inter-group comparisons were made by repeated measures one-way anova with post-hoc Tukey tests of significance. CV, control diet, vehicle (saline) injected; EV, ethanol diet, vehicle treated; CM, control diet, myriocin treated; EM, ethanol diet, myriocin treated.