
Figure 3.
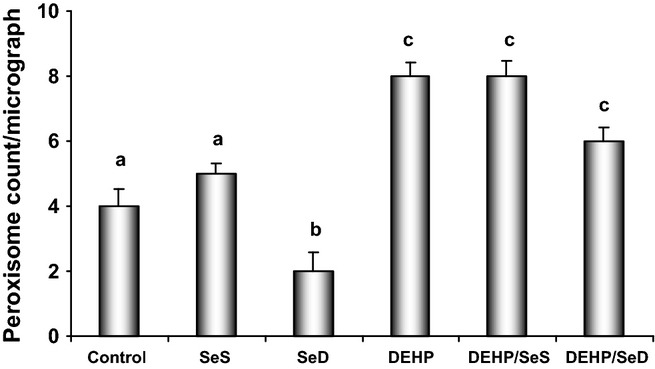
The Peroxisome count in hepatocytes in the study groups. Bars represent the average number of peroxisomes counted in eight random representative ultrastructural photomicrographs in each group. All results were given as mean ± SEM of n = 6 animals. Bars that do not share same letters (superscripts) are significantly different from each other (P < 0.05). Experimental groups for 5 week were on the following: (c) regular diet (0.15 mg/kg Se); (SeS) Se-supplemented diet (1 mg/kg Se); (SeD) Se-deficient diet (≤0.05 mg/kg Se); di(2-ethylhexyl)phthalate (DEHP) regular diet (0.15 mg/kg Se) and received 1000 mg/kg, i.g. DEHP for the last 10 days; (DEHP/SeS) Se-supplemented diet (1 mg/kg Se) and received 1000 mg/kg, i.g. DEHP for the last 10 days; (DEHP/SeD) Se-deficient diet (≤0.05 mg/kg Se) and received 1000 mg/kg, i.g. DEHP for the last 10 days. Significantly higher number of peroxisomes was detected in DEHP, DEHP/SeS and DEHP/SeD groups compared with control group.