
Figure 5.
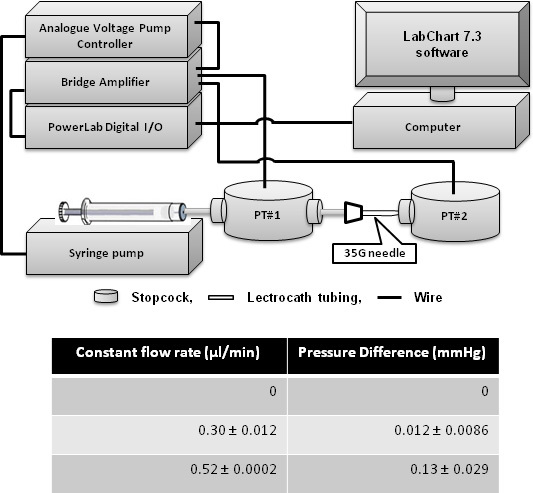
Validation of pressure transduction accuracy. A pressure transducer (PT#1) was connected to a 35-G needle that was inserted into the lumen of a closed hub of a rigid three-way connector directly attached to a second pressure transducer (PT#2). At flow rates of 0.30±0.012 (mean ± standard deviation [SD]) and 0.52±0.0002 µl/min, the pressure difference between PT#1 and PT#2 was 0.012±0.0086 and 0.13±0.029 mmHg, respectively. This represented a small artifactual increase in transduced pressure in PT#1 due to needle resistance. Thus, at an outflow rate of 0.086 µl/min corresponding to physiologic mouse intraocular pressure (IOP) of 15 mmHg, PT#1 transduced pressure marginally overestimated IOP (PT#2) by a mean of 0.059 mmHg or 0.02%. This marginal difference was considered negligible.