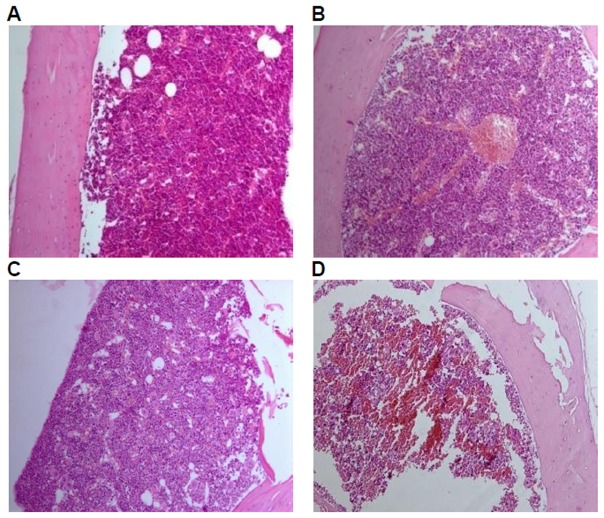
Figure 5. Bone marrow tissue of mice fed with diets containing GM corn and parental corn.
Photomicrographs of histomorphological examination (100×) of bone marrow in female BALB/c mice in negative control group(A), non-genetically modified parental corn group(B), genetically modified corn group(C), and positive control group(D). Sections of the bone marrow from Group A, Group B, and Group C show normal architecture. Section of the bone marrow from Group D reveals decrease in the number of hematopoietic stem cells.

