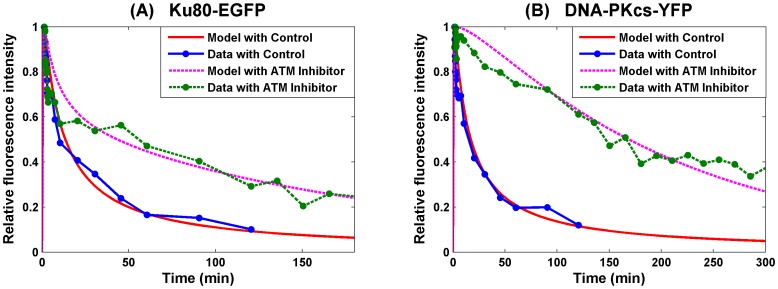
Figure 4. SF Model - Formation and loss of Ku80-EGFP and DNA-PKcs-YFP at the DSB in the radiation stripes with ends processing preceding synapsis formation.
Panel (A) is for Ku80-EGFP and panel (B) for DNA-PKcs-YFP. The lines with dots are experimental data from [1], and those without dots are numerical simulation of the model. The solid lines are represent calculated normalized fluorescence intensity of the respective fluorescently tagged proteins with control, and the dashed lines are with ATM inhibitor present.

