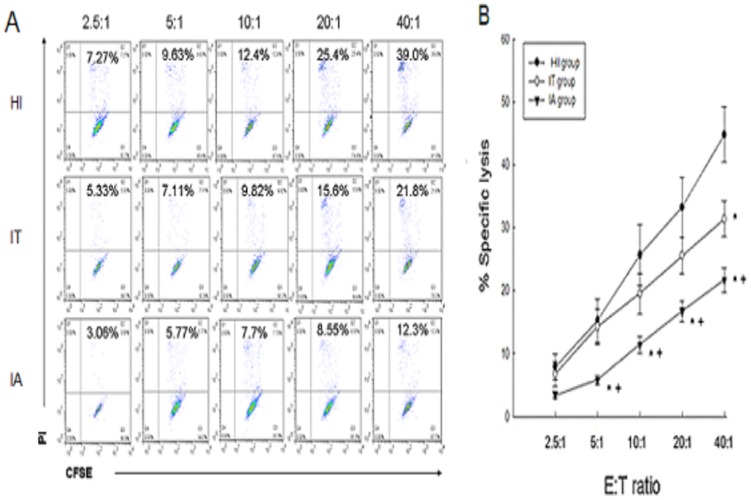
Figure 2. Cytotoxicity of peripheral NK cells.
(A) Representative dot plots show K562 lysis by PBMCs from the three groups at different E∶T ratios (2.5∶1,5∶1,10∶1,20∶1, and 40∶1). (B) The cytotoxic activity of peripheral NK cells from the HI (n = 18), patients in the IT stage of CHB (n = 15), and patients in the IA stage of CHB (n = 42) at various E∶T ratios. The mean and standard error are shown. Asterisk represents p<0.05 compared to HI. Crosses represent p<0.05 compared to patients in the IT stage of CHB.

