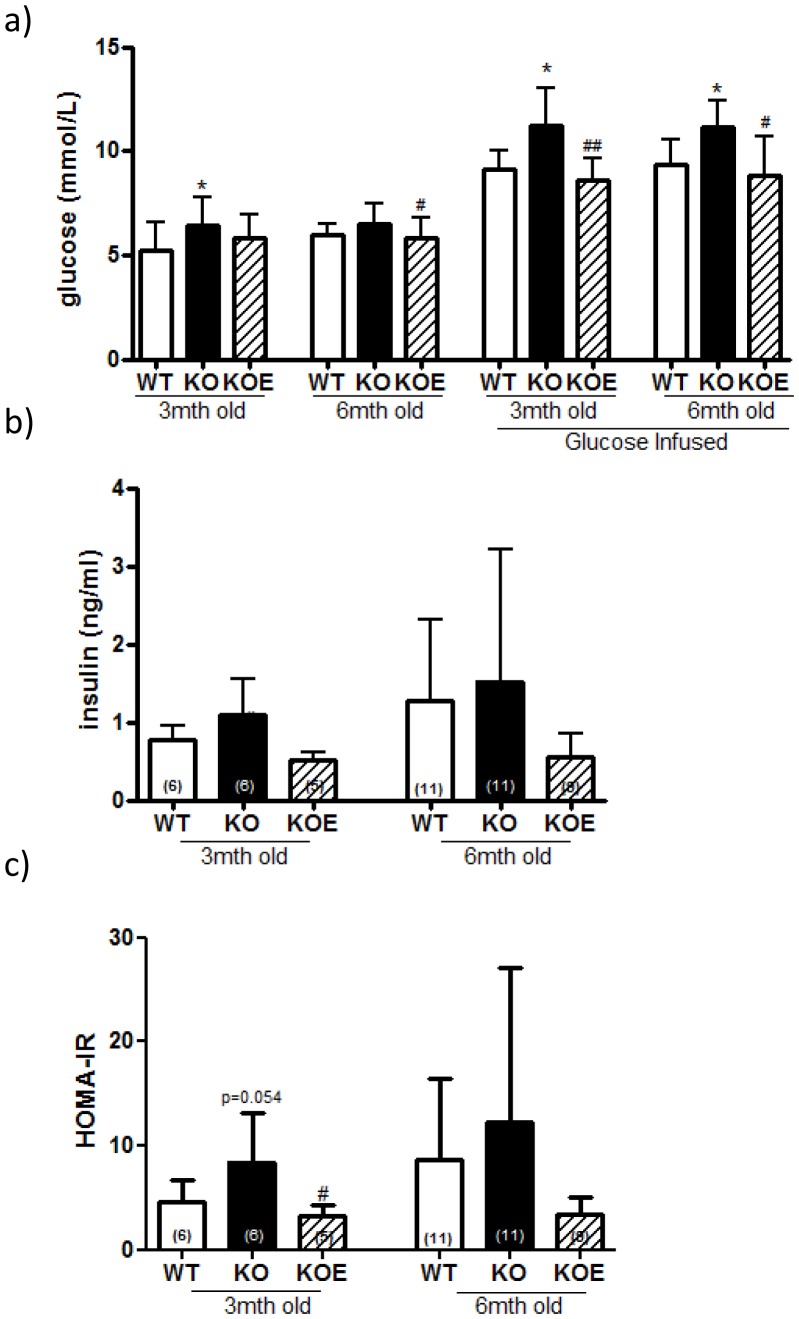
Figure 1. Serum glucose, insulin and HOMA-IR levels.
(a) Fasted and 20 min post glucose infused serum glucose (b) Fasted serum insulin and (c) HOMA-IR (fasted serum glucose (mmol/l) × fasted serum insulin (µU/l)/22.5) from 3 and 6 month-old fasted male wildtype (WT) and aromatase knockout (KO) and KO treated with 2.5 µg/day estrogen (KOE). Expression data from samples (n = shown on corresponding bar) per genotype are shown, and are presented from replicate analysis as the mean ± SD. *p<0.05 versus WT mice. # p<0.05 versus KO.

