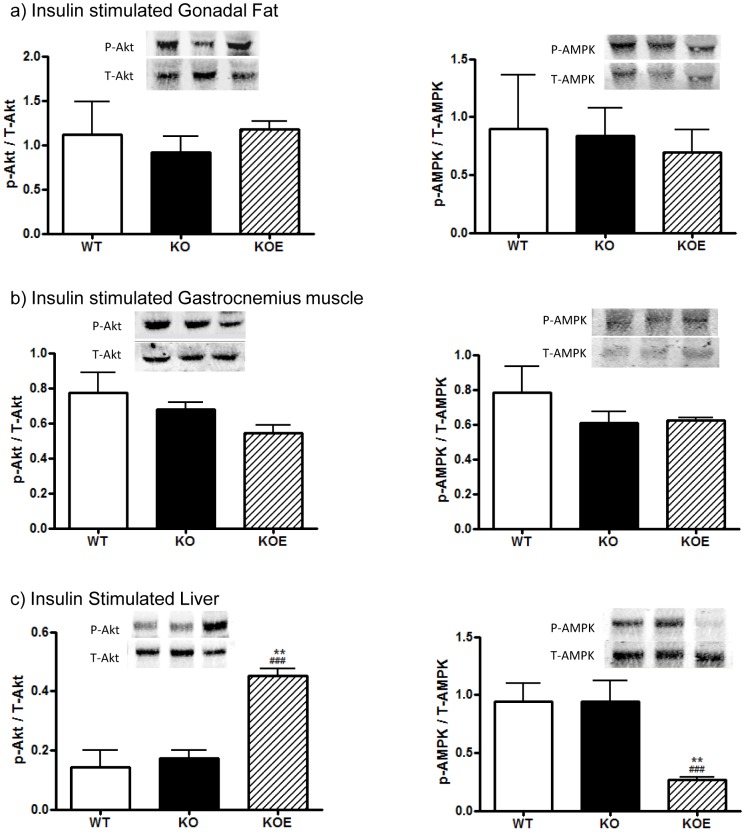
Figure 5. Western blot analyses of insulin stimulated and basal tissue.
Protein phosphorylation analyses of Akt and AMPK levels were performed on protein extracted from insulin stimulated (a) gonadal adipose tissue, (b) gastrocnemius muscle, (c) liver in insulin stimulated liver of 6 month-old male wildtype (WT) and aromatase knockout (KO) and 2.5 µg/day estrogen-replaced KO (KOE) mice. Expression data from 6–8 samples per genotype are shown, and presented from replicate analysis as the mean ± SD. *p<0.05, **p<0.01, ***p<0.001 versus expression in age-matched WT samples and #p<0.05, ###p<0.001 versus KO samples.

