
Figure 2. Genomic map of EN2 and five flanking genes.
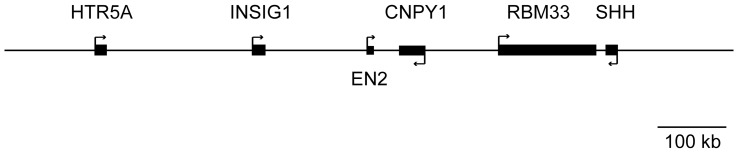
Genomic region encompassing 500 kb upstream and 500 kb downstream of EN2 gene is illustrated and drawn to scale. Solid boxes represent each gene and arrows indicate the transcribed DNA strand. Gene symbols for each gene are shown.