
Figure 3. SHH,INSIG1, and CNPY1 levels are correlated with affection status or rs1861972-rs1861973 genotype.
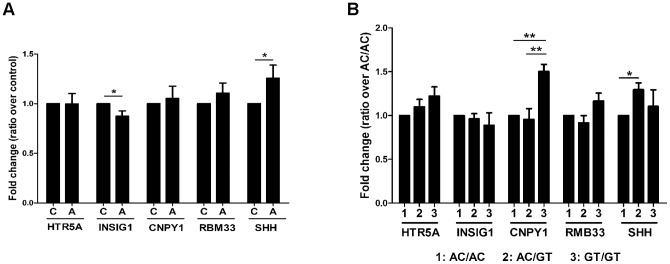
mRNA levels of the five flanking genes were measured using Taqman qRT-PCR. No interaction between affection status and genotype was observed, so comparisions between autism and control group were made regardless of genotype (A) and between the three genotypes regardless of affection status (B). (A) For each gene control levels are normalized to 1,and transcript levels are presented as fold change in autism using ΔΔCt values. Type 3 tests of fixed effects, *p<0.05. Note that SHH and INSIG1 levels are significantly altered in affected individuals. C – control, A – autism group. (B) Each transcript level is normalized to 1 for the genotype with the lowest quantity (AC/AC for HTR5A; GT/GT for INSIG1; AC/GT for CNPY1; AC/GT for RBM33; AC/AC for SHH). Levels for other genotypes are presented as fold change using ΔΔCt values. Type 3 tests of fixed effects, *p<0.05, **p<0.01. CNPY1 and SHH levels are correlated with rs1861972-rs1861973 genotype.