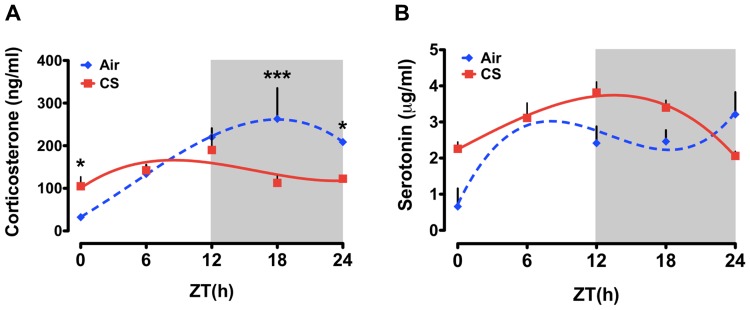
Figure 3. Daily rhythms of plasma CORT and 5HT in mice exposed to chronic (6 month) air or CS.
Mice were exposed to chronic CS for 6 months and plasma samples were collected every 6-h interval (ZT0, ZT6, ZT12, ZT18 and ZT24) after 24 h of last CS exposure. Plasma levels of (A) CORT and (B) 5HT and were determined by ELISA. Gray shading indicates the dark phase (ZT12 to ZT24). Data from air- and CS-exposed mice are shown as mean ± SEM (n = 3–4 mice per group). Data were analyzed with non-linear regression (multi-order polynomial) analyses. *P<0.05 significant compared to air-exposed mice at ZT0; *P<0.05 significant compared to CS-exposed mice at ZT24; ***P<0.001 significant compared to CS-exposed mice at ZT18.

