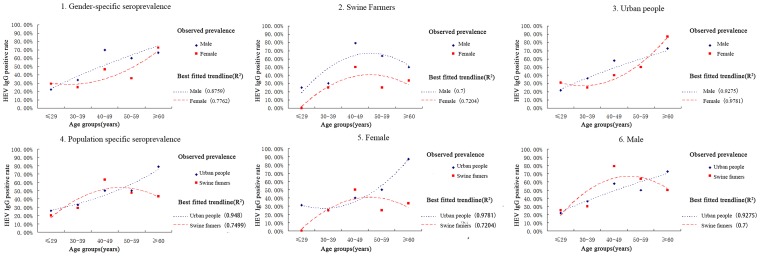
Figure 4. The estimated seroprevalence of the hepatitis E virus in Guangdong Province.
The best fit trendline for the positive rate data was selected based on the R-squared value of the curves drawn using the Microsoft Office Excel 2007 program (Microsoft, Redmond, WA). 1. Overall gender-specific seroprevalence; 2. Gender-specific seroprevalence of swine farm; 3. Gender-specific seroprevalence of the general population; 4. Overall population-specific seroprevalence; 5. Population-specific seroprevalence of females; 6. Population-specific seroprevalence of males.

