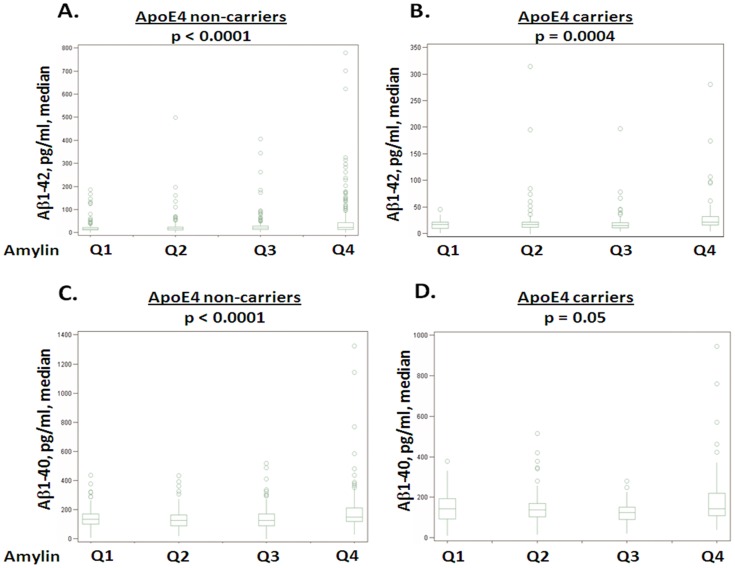
Figure 1. Characterization of Aβ with increasing amylin quartiles.
Subjects are divided into four quartiles based on the concentration of amylin in plasma. Box plots were used to illustrate the median concentration with 25% (Q1) and 75% (Q3) range of plasma Aβ. Plasma Aβ1-42 (A and B) and Aβ1-40 (C and D) in the absence (A and C) and presence (B and D) of ApoE4 allele in quartile 1 (Q1), quartile 2 (Q2), quartile 3 (Q3) and quartile 4 (Q4) of plasma amylin are shown.

