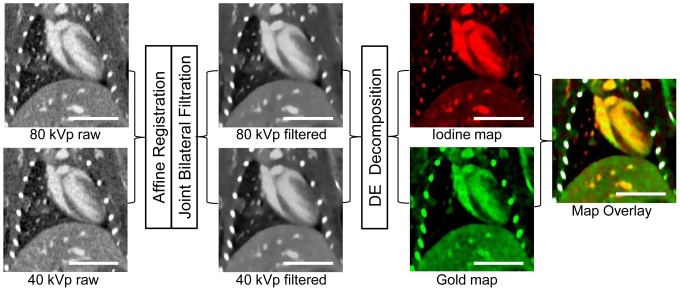
Figure 2. Dual-energy decomposition process diagram.
Raw 40 kVp and 80 kVP datasets were acquired, and then they underwent affine registration and joint bilateral filtration to produce filtered data sets. Dual-energy decomposition was performed on these filtered images, which resulted in two independent images (maps) representing the iodine and gold concentration in each voxel. After obtaining the two maps, the images were overlaid and the bones were segmented out (colored white) to form the final concentration map overlay. These images were taken from CT scan 3, in which both iodine and gold were present in the blood stream. The scale bar represents 1 cm in all images. The 40 and 80 kVp images are windowed from −300 to 1200 HU, the iodine maps are windowed from 0.25 to 15 mg/mL, and gold maps are windowed from 0.25 to 6 mg/mL.

