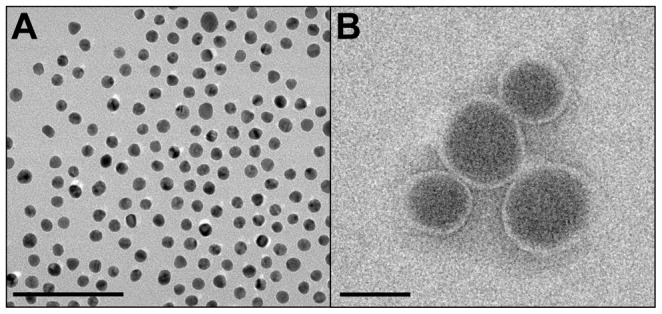
Figure 3. TEM of nanoparticles.

PEGylated gold nanoparticles are shown in (A) and iodine-containing liposomes in (B). The scale bar represents 100 nm for both panels.

PEGylated gold nanoparticles are shown in (A) and iodine-containing liposomes in (B). The scale bar represents 100 nm for both panels.