
Figure 3. Adipose expression levels of genes related to lipoprotein uptake and fatty acid oxidation in SOY and FSOY groups compared to CTRL and CHOL groups.
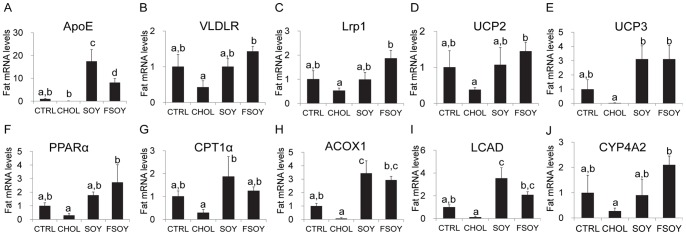
mRNA levels of ApoE (A), VLDLR (B), Lrp1 (C), UCP2 (D), UCP3 (E), PPARα (F), CPT1α (G) ACOX1 (H), LCAD (I) and CYP4A1 (J) in rats fed experimental diets. The results are expressed as means ± SE of eight animal tissues. Values not sharing the same letter were significantly different (P<0.05) between all groups by ANOVA.