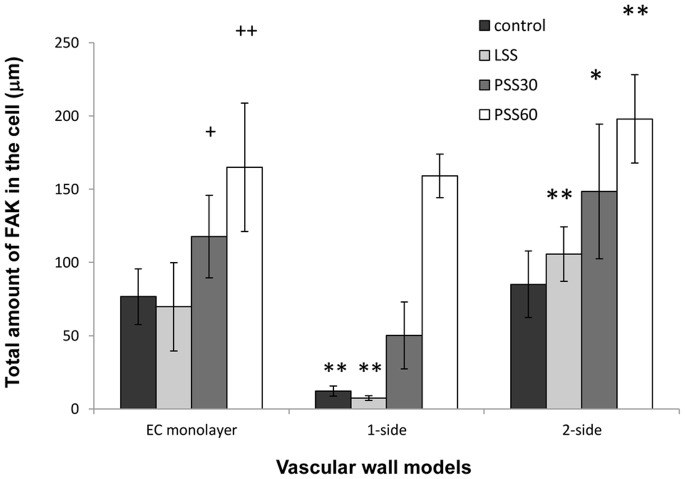
Figure 4. The total amount of FAK per cell in the three vascular wall models.
Total amount of FAK per cell distribution in the different models in static conditions and following exposure to WSS of 4 dyne/cm2 for 30 min (LSS) and to WSS of 12 dyne/cm2 for 30 (PSS30) and 60 min (PSS60). The average amount of FAK per cells was calculated by multiplying the average FAK plaque length and average amount of plaques per cell, taken from measured data produced from the FAK images. The amount of FAK increased following exposure to 12 dyne/cm2 in a time dependent manner, but was not affected by exposure to 4 dyne/cm2 in any of the three models. The amount of FAK in the 1-side model was the lowest in the control as well as following exposure to 30 min of 4 and 12 dyne/cm2. The amount of FAK in the 2-side model was the highest in all WSS exposure modes. (+ - P<0.05 compared to the same model without WSS. ++ - P<0.001 compared to the same model without WSS. * - P<0.05 compared to the EC monolayer model following the same exposure to WSS. ** - P<0.001 compared to the EC monolayer model following the same exposure to WSS).

