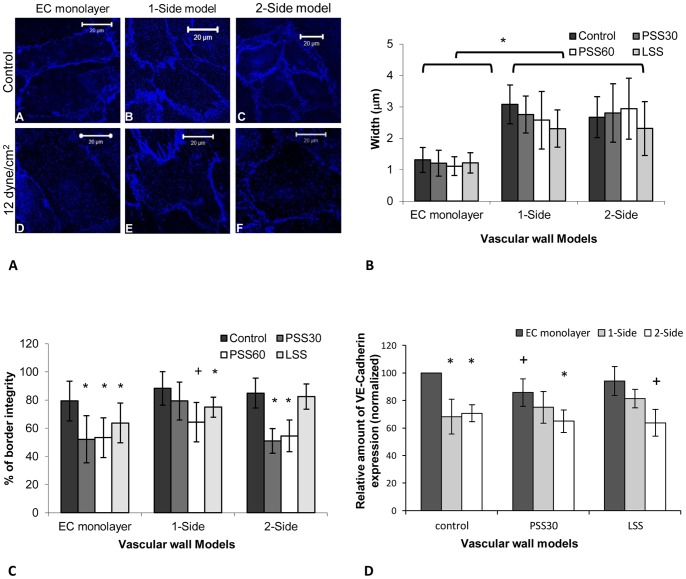
Figure 5. VE-Cadherin analysis.
A - The VE-Cadherin marks the border of the cells, with a wider mark of the cell borders in the 1 and 2-side models (B and C). Following exposure to WSS there was a dissociation of the VE-Cadherin stain (D–F). B - The stain thickness distribution, as measured from the images of the VE-Cadherin, in the different models with and without exposure to WSS. The thickness distribution in the EC monolayer was around 1 µm, whereas in the co-culture models it was roughly 2 to 3 µm. The difference across models was significance. C - The continuity in the vascular wall models, as estimated from the VE-Cadherin images, following exposure to a WSS of 12 dyne/cm2 for 30 and 60 min and a WSS of 4 dyne/cm2 for 30 min and without WSS exposure. VE-Cadherin continuity was high in static conditions and declined when the cells were exposed to a WSS of 12 dyne/cm2, with a significant effect in the 1-side model alone following 60 min of exposure. Following exposure to a WSS of 4 dyne/cm2 this continuity only decline significantly in the EC monolayer model. D - VE-Cadherin expression in the endothelial cells of the different models following exposure to 30 min of a WSS of 4 and 12 dyne/cm2 and without exposure to WSS. The change in VE-Cadherin expression was significant when comparing the EC monolayer model to the two co-culture models; however the change in the amount of VE-Cadherin did not vary significantly in each model following exposure to WSS. The presented data is normalized to the EC-monolayer result in static conditions (control) sample. LSS - WSS of 4 dyne/cm2 for 30 min; PSS30 - WSS of 12 dyne/cm2 for 30 and PSS60 - of 12 dyne/cm2 for 60 min. (+ - P<0.05 compared to the same model without WSS. * - P<0.05 compared to the EC monolayer model following the same exposure to WSS).

