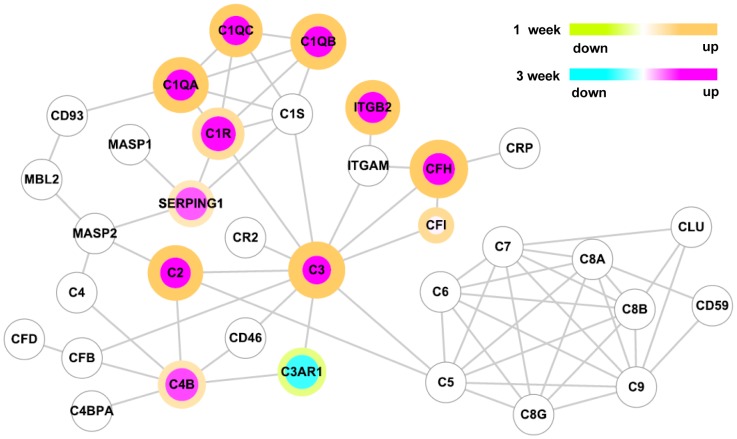
Figure 3. The complement pathway protein-protein interaction network.
Nodes represent proteins and lines represent physical interactions between them. The color of the node indicates the fold-change in gene expression at 3 weeks relative to that in the control sham group. The color of the node border indicates the fold-change in expression at 1 week relative to that in the control sham group. Color scales are shown in the upper right. The fold-changes were log2-transformed and only genes that showed significantly different expressions (p<0.05 by Student’s t-test and absolute fold-change > 1.5) were color-mapped.

