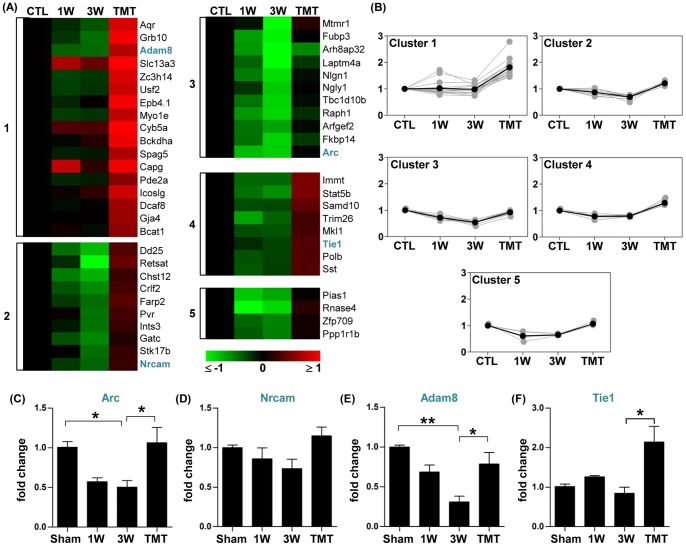
Figure 8. Genes upregulated by treadmill training.
(A) Color-coded heatmaps of gene expression levels for the genes whose expression was higher with treadmill training (TMT) than without TMT at 3 weeks after injury. Fold changes in gene expression level relative to the sham group expression level were log2-transformed and color-coded based on the color scale shown at the bottom. Genes were grouped into 5 clusters using a k-means clustering algorithm. The numbers shown at the left side of heatmaps indicate the cluster indexes to which the genes belong. Genes for which validation data are presented are shown in blue. (B) Expression patterns of genes in each cluster. Gray lines indicate expression levels of individual genes and black lines indicate the average expression level of all genes in the cluster. Numbers on the Y-axis indicate log2-transformed fold changes relative to the expression level in the sham group. (C-F) Graphs of real-time RT-PCR results for genes selected from the list in (A) (shown in blue). N = 4 animals for each group. *, **, and *** represent p<0.05, p<0.01, and p<0.001, respectively, by one-way ANOVA followed by Tukey's post-hoc analysis. Error bars represent SEM.

