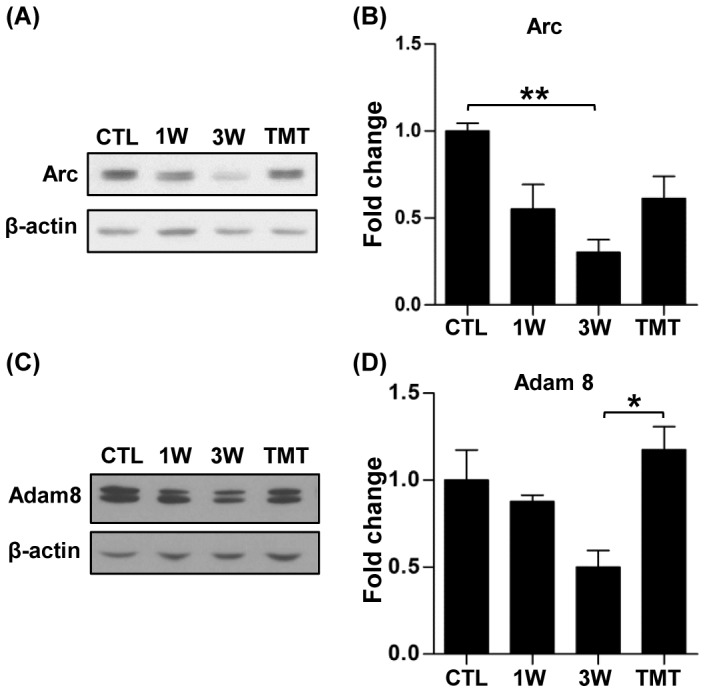
Figure 9. Validation of changes in protein expression from the Arc and Adam8 genes.

(A, C) Representative western blots of Arc (A) and Adam8 (C). β-actin was used to normalize differences in loading amounts. (B, D) Quantification graphs of Arc (B) and Adam8 (D) western blots. Data are presented as fold-changes relative to the normal protein expression level after normalization with β-actin. N = 3 to 4 animals for each group. * and ** represent p<0.05 and p<0.01, respectively, by one-way ANOVA followed by Tukey's post-hoc analysis.
