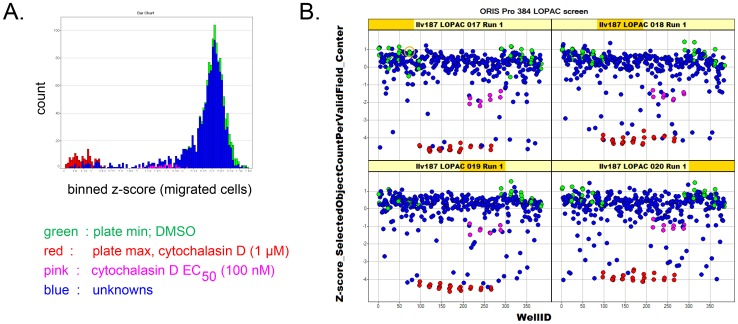
Figure 3. LOPAC library screening for inhibitors of cell migration.
Cells were treated in duplicate Oris™ Pro 384 plates with vehicle (green), 1 µM cytochalasin D (red), 0.1 µM cytochalasin D (pink), or 10 µM of compounds (blue) for 2 days. Cells that migrated into the exclusion zone were enumerated by high-content analysis on the ArrayScan II. A. Histograms show that positive and negative controls were well separated and data largely followed a normal distribution. B. Trellis plots. Z-scores were calculated for each data point based on plate average and plotted against well number. Data are from one replicate run; the y-axis shows z-scores of migrated cells.

