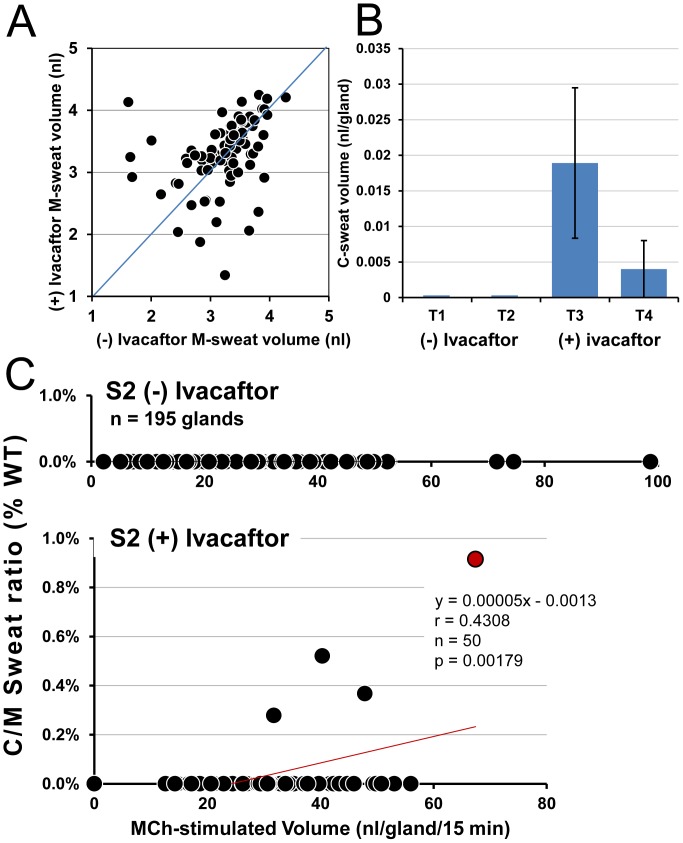
Figure 3. M- and C-sweat secretion (±) ivacaftor for CF subject 2: female, F508del/G551D.
(A) M-sweat responses were unchanged by ivacaftor in this subject. Each point is log transformed values for a single pre-test and mean of 2 post-test measures for each of 87 glands. Mean volumes were 28.2±12.5 vs. 31.9±14.6 nl−gland, pre and post, n = 87 glands p = 0.12, paired t-test on log transformed data, plotted as in Fig. 2A. (B) Bar graphs show C-sweat volumes (mean ± SEM) for (±) ivacaftor conditions; 2 tests in each condition. One (−) ivacaftor test was at a different site. (The means are based on glands 1–50). (C) Gland-by-gland C-sweat secretion ± ivacaftor. Each symbol shows correlations for each gland between mean M-sweat volumes (x axis) vs. C-sweat/M-sweat ratio expressed as a% of mean WT value (y axis). (Top graph, truncated y axis) shows measurements (−) ivacaftor. Each point is M-sweat volume for a single test for 195 identified glands at two sites; C-sweat was zero. (Bottom graph) shows measurements (+) ivacaftor (mean of 2 tests). Four of 87 glands produced C-sweat, only one gland secreted on both tests (red symbol). Red line is linear fit. This was the smallest response observed for any subject (+) ivacaftor.

