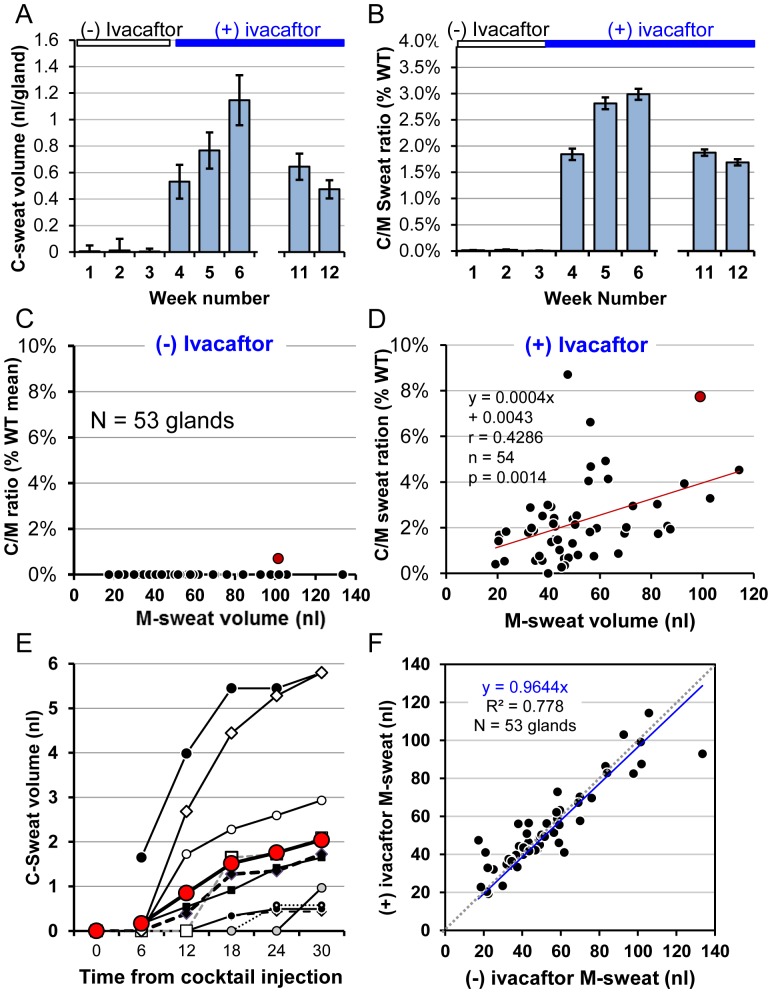
Figure 8. Summary data for S8, R117H-5T, (±) ivacaftor.
(A) Mean ± SEM for the final (30 min) volume of C-sweat secretion per gland (50–53 glands measured for each test) (±) ivacaftor. (B) C-sweat/M-sweat ratios expressed as percent of the WT mean. Results are means ± SEM for 49–53 glands per test. (C-D) Gland-by-gland correlations of M-sweat and C-sweat responses in the absence (C), and presence (D) of ivacaftor. Each symbol represents a single gland and shows its average C/M ratio expressed as a% of the WT average (y-axis) vs. its mean M-sweat volume (x-axis). A single gland (G43) in the original ROI produced C-sweat (−) ivacaftor (red symbol); this gland had the second highest C/M ratio in the (+) ivacaftor condition (red symbol). In the (+) ivacaftor condition, 92% of the glands in the ROI produced C-sweat on at least one of the 3 trials, at C/M ratios 0.3%–8.7% of the mean WT C/M ratio. (E) C-sweat volume vs. time for 10 responding glands selected to represent the range of responses for S8 (+) ivacaftor. β-adrenergic cocktail injected at time 0. (F) Absence of ivacaftor effect on M-sweating in this subject. Each point represents a single identified sweat gland, and shows the average M-sweat volumes from 3 tests (−) ivacaftor (x-axis) and 5 tests (+) ivacaftor (y-axis). Dashed 45 degree line indicates equivalence; linear fit does not differ significantly from it.

