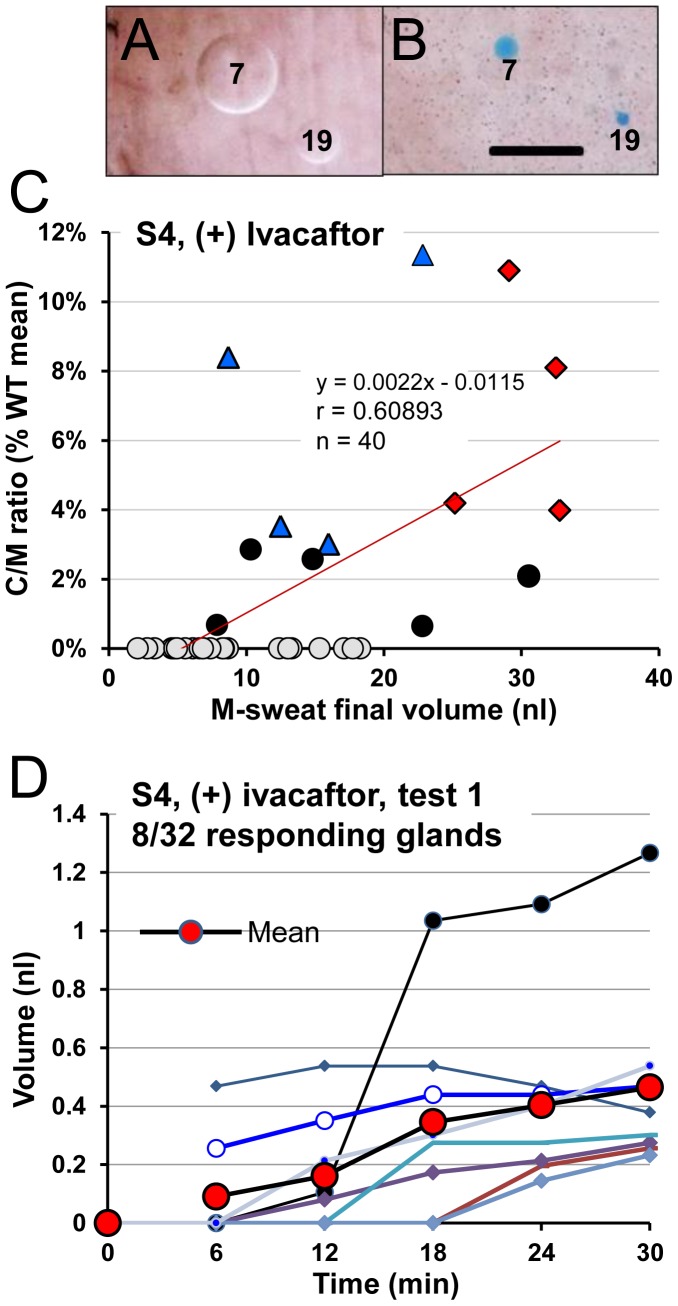
Figure 9. Summary data for S4, a female CF subject having two potentially responsive mutations: G551D & R117H-5T who was tested 3 times (+) ivacaftor.
(A) Examples of M-sweat. (B) Examples of C-sweat. Calibration = 0.5 mm. (C) Gland-by-gland correlations of M- and C-sweating using same conventions as previous figures. Symbols: Filled circles, C-sweat on 1/3 trials, blue triangles, 2/3 trials and red diamonds, 3/3 trials. (D) Volume vs. time plots for C-sweating from a single experiment (test 1). β-adrenergic cocktail injected at time 0.

