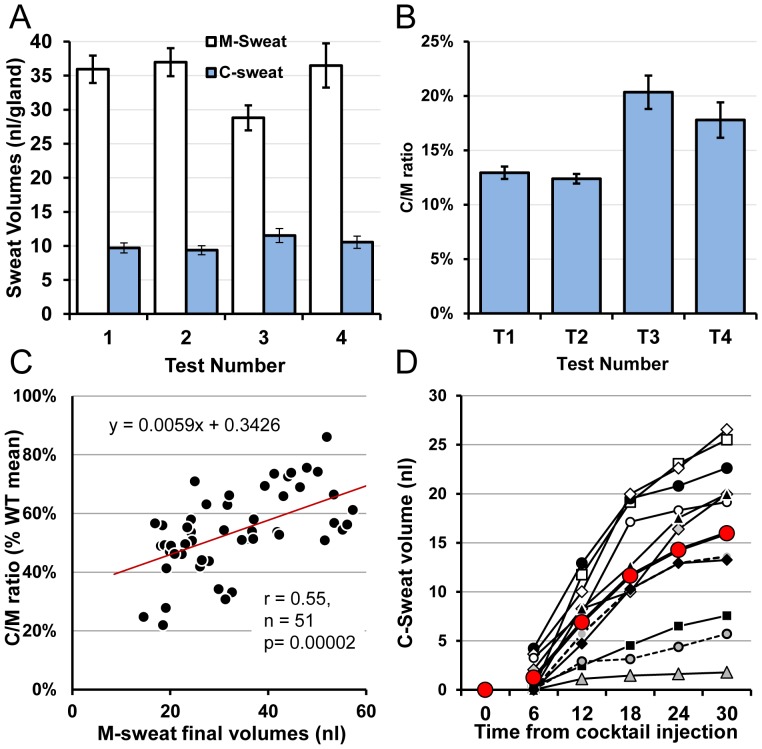
Figure 10. M- and C-sweating in a female, healthy control subject.
(A) M-sweat and C-sweat responses for each of 4 tests (Mean ± SEM, n = 51 glands). Each open bar is the average final M-sweat volume in response to 15 min stimulation with MCh; each blue bar is the average final C-sweat volume in response to 30 min of β-adrenergic cocktail. (B) C-sweat/M-sweat ratios for each test. (C) Gland-by-gland correlation of mean C/M sweat ratios, expressed as a% of the WT average, vs. the mean M-sweat response. Each symbol represents mean values for a single gland based on ∼4 tests. Responses for this subject were at the low end of the control range. (D) Time course of C-sweating in 11 responsive glands selected to cover the range of C-sweat secretion rates.

