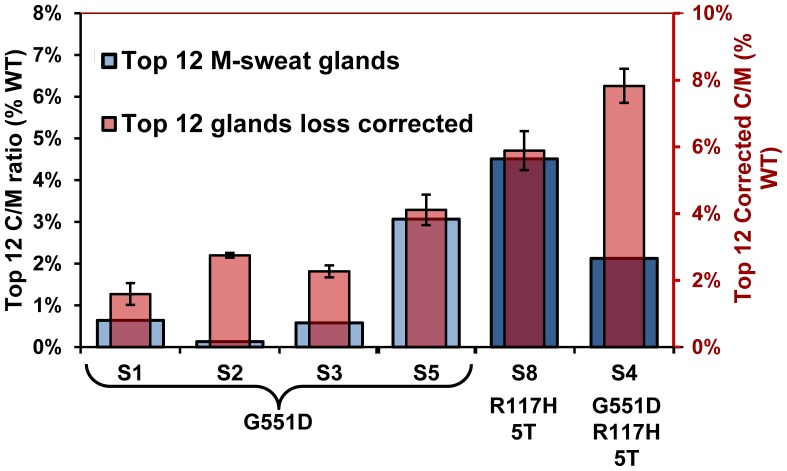
Figure 13. Loss-reduced and loss-corrected estimates of CFTR function in CF subjects (+) ivacaftor.
Each blue column (left axis) shows mean C/M ratios (mean ± SEM) for the 12 glands with the highest M-sweat rates for each subject; higher sweat rates reduce C-sweat losses. Each transparent red column (right axis) shows the corrected C/M ratios (mean ± SEM) for the 12 fastest M-secreting glands, obtained by adding 0.029 nl−min−gland to the observed C-sweat secretion rates (see text).

