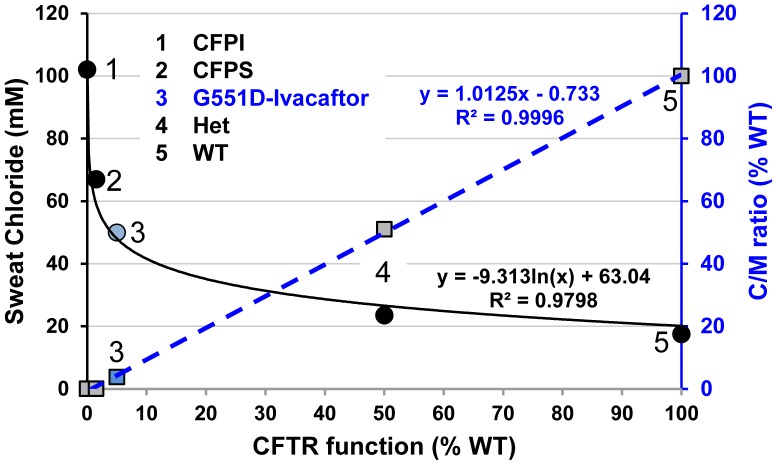
Figure 14. Two measures of CFTR function in the sweat gland.
The sweat chloride concentration (left y axis,) is plotted (solid line) against CFTR function as a% of average WT values, plotted on the x axis. Sweat chloride is an inverse logarithmic function of CFTR function (n PO γ) and hence is most sensitive at the lowest levels of CFTR function. The C-sweat/M-sweat ratio as% WT (right axis), is plotted (dashed line) against CFTR function as a% of average WT values, plotted on the x axis. The C/M ratio provides a direct readout of CFTR function and is linear over most of the range; the loss-reduced and loss-corrected values extend the linear range close to zero CFTR function. Sweat chloride point 3 is from ref. [5], the rest are from ref. [38]. C/M point 3 is from present paper, other points are from ref. [10]. CFTR values 0, 50 and 100 are defined, 1.5% and 5% function assigned by patch clamp and mRNA measures.

