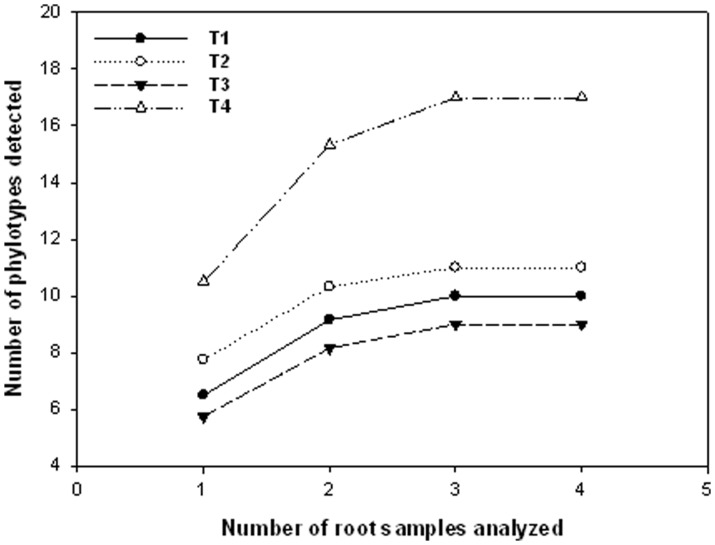
Figure 2. Sampling effort curves for Prunus persica roots under different treatments analysed.
T1: Combination of organic and inorganic fertilization and integrated pest management; T2: Inorganic fertilization and integrated pest management; T3: Inorganic fertilization and chemical pest control; T4: Combination of organic and inorganic fertilization and chemical pest control. The number of clones for each AMF phylotypes in each root sample was used to construct the sampling effort curves (with 95% confidence intervals) using the software EstimateS 8.00 (Colwell, [33]). The sample order was randomized by 100 replications.

