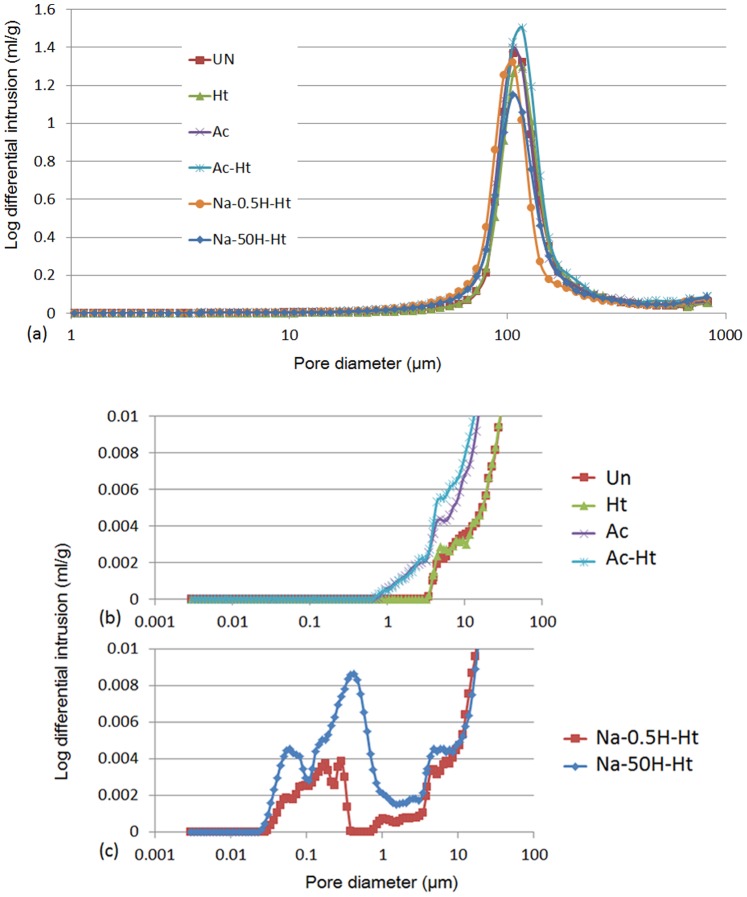
Figure 3. Distribution of pore diameters on a full scale (a) and expansions (b), (c) for the porous Ti metals subjected to various treatments given in Table 1, as measured by Hg penetration porosimetry, where the x-axis is pore diameter, and the y-axis is log differential volume of Hg that penetrated into the pores of the sample per unit weight.
Un: Untreated, Ht: heat treated, Ac: Mixed acid treated, Ac-Ht: Mixed acid and heat treated, Na-0.5H-Ht: NaOH: NaOH, 0.5 mM HCl and heat treated, Na-50H-Ht: NaOH, 50 mM HCl and heat treated.

