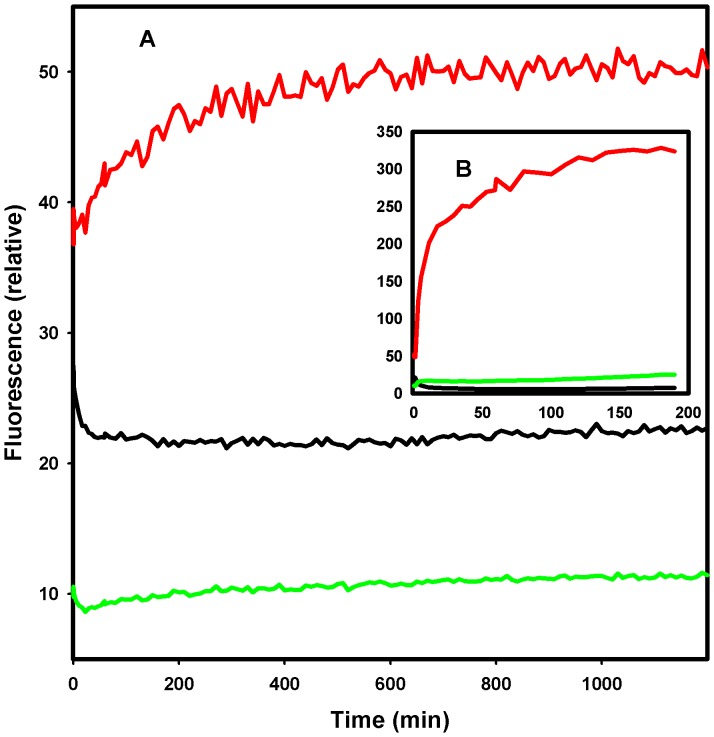
Figure 10. Fluorescence of (125 µM DOPG + 1.25 µM DOPE) vesicles labeled with either rhodamine or NBD in separate vesicles.
The excitation wavelength was 460(NBD, maximum absorption) while the emission wavelengths were 535 nm (NBD) and 592 (rhodamine). Fusion resulting in FRET from NBD to rhodamine is indicated by a diminution of NBD fluorescence (middle curve) and an increase in rhodamine fluorescence (lowest curve). The top curve of A is the ratio of rhodamine fluorescence to NBD. At zero time the solution was brought to 1.12 µM Str enolase. In B, 1 mM CaCl2 was added to the sample. Str enolase clearly brings about a slow fusion of about 5% of the vesicles (relative to Ca).

