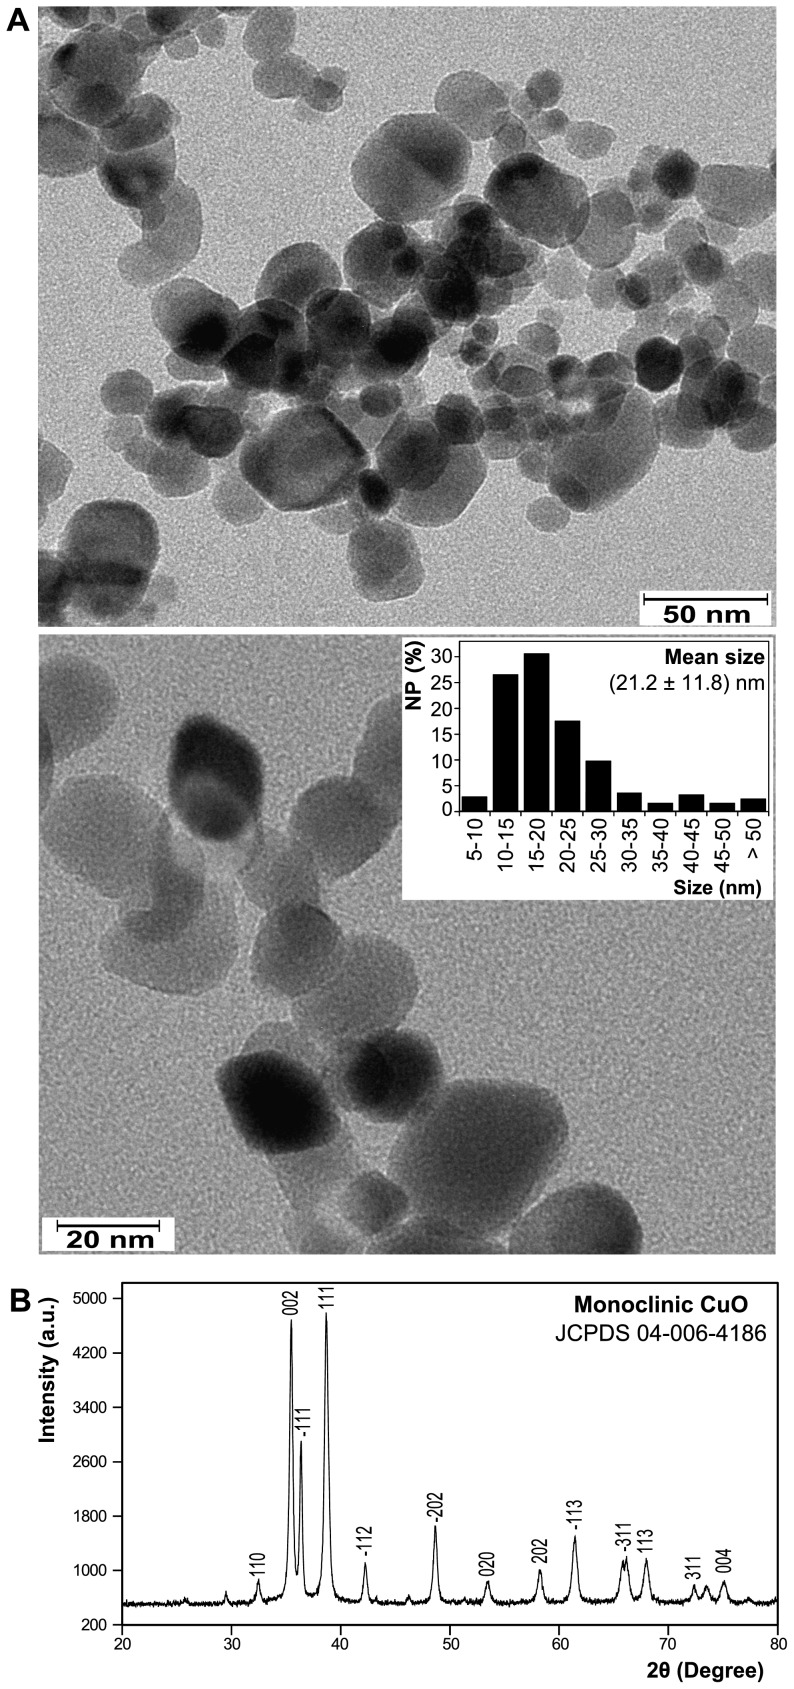
Figure 1. Characterization of CuO NP used in the present study.
(A) Representative transmission electron microscopy (TEM) images of the CuO NP at two magnifications. The polydisperse size distribution of CuO NP (n = 245) determined from TEM images is shown in the insert. The average size of the NP is shown (mean ± SD). (B) X-Ray diffraction (XRD) pattern of the NP. The X, and Y axes of the XRD represents the angles (2θ) of incident X-ray beam and the corresponding diffraction peak intensity.

