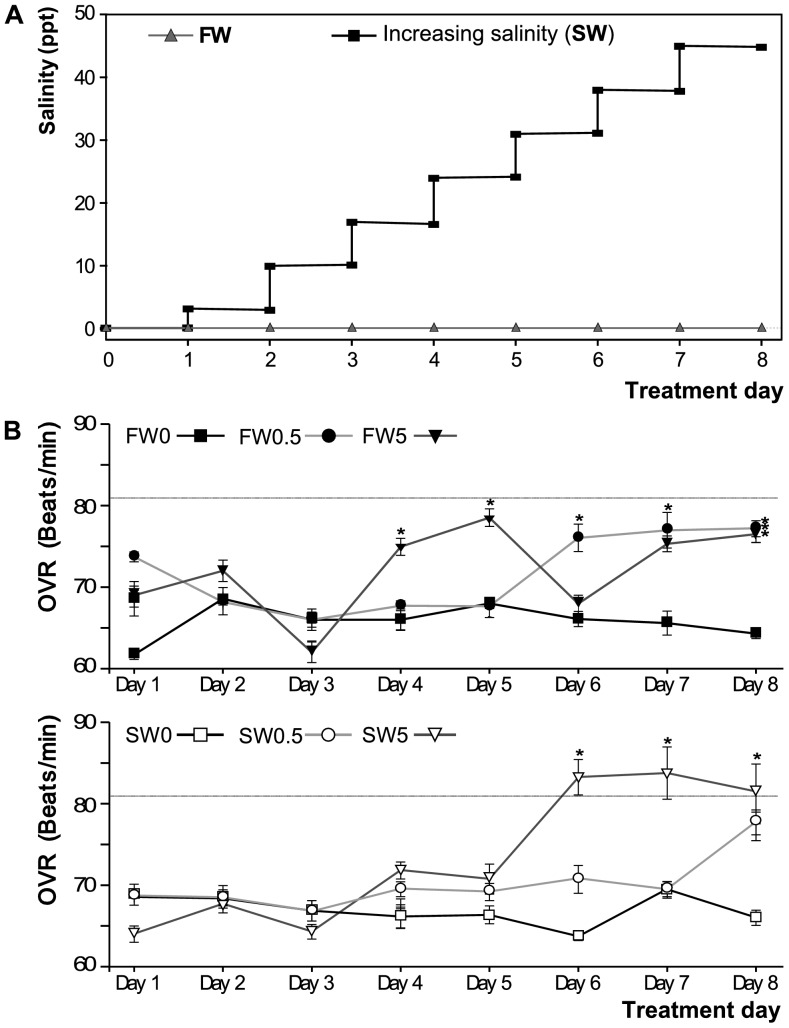
Figure 3. Experimental conditions during CuO NP exposure.
(A) Salinity changes regime for FW and SW tanks. The FW tanks were kept in constant freshwater (0.1 ppt, gray triangles), while in SW tanks, salinity was increased in a stepwise manner every day (black squares), by addition of increasing amounts of sea salt. Salinity increase steps were of 7 ppt/day, except for the first day when the increase was of 3 ppt. (B) Opercular ventilation rate (OVR) in experimental tanks, measured as opercular beats/minute and expressed as the daily mean per tank (n = 7). The dotted line represent the 25% increment selected as experimental end point. Asterisks denote significant differences relative to the FW0 per day (P<0.05). Top: FW0, fresh water; FW0.5, FW plus 0.5 mg·L−1 CuO; FW5, FW plus 5 mg·L−1 CuO; Bottom: SW0, increasing salinity; SW0.5, SW plus 0.5 mg·L−1 CuO; SW5, SW plus 5 mg·L−1 CuO. n×tank = 7.

