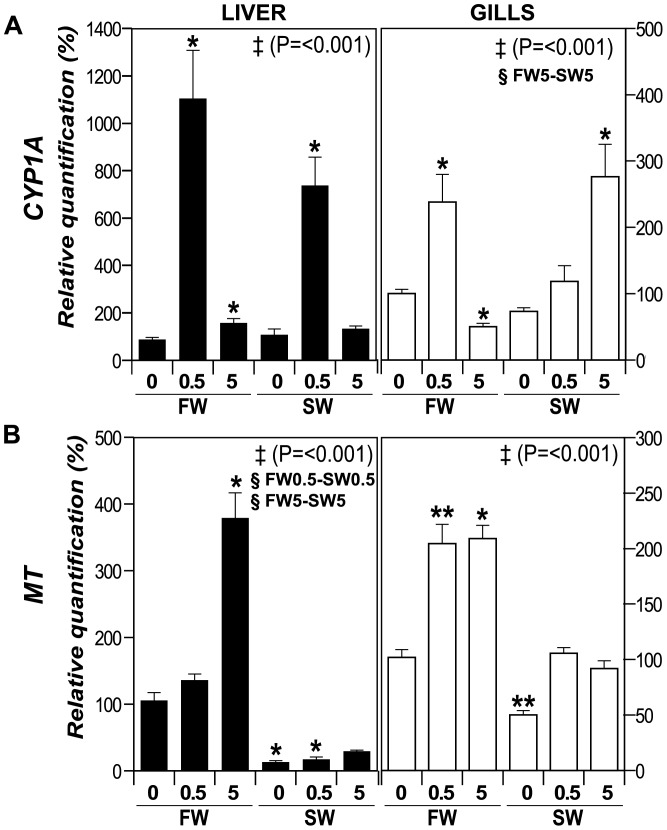
Figure 7. Expression of metal-responsive genes.
Transcripts levels analysis by qPCR in liver (black bars) and gills (white bars). Transcript accumulation of (A) Cytochrome P450 1A (CYP1A), and (B) Metallothionein (MT). The genes were analyzed by qPCR in gills and liver, and normalized as function of the levels of endogenous control β-Actin gene. FW0, fresh water; FW0.5, FW plus 0.5 mg·L−1 CuO; FW5, FW plus 5 mg·L−1 CuO; SW0, increasing salinity; SW0.5, SW plus 0.5 mg·L−1 CuO; SW5, SW plus 5 mg·L−1 CuO. Results expressed as percentage of relative quantification. Significant different means by Anova on ranks analysis are shown with ‡ (P value), and significant differences between FW-SW at the same CuO NP concentration (Dunn's post test, P<0.05) are shown with §. Asterisks represent significant difference compared to the respective FW0 control by Wilcoxon Signed Rank test (*, P<0.05; ** P<0.025). n×treatment = 5.

