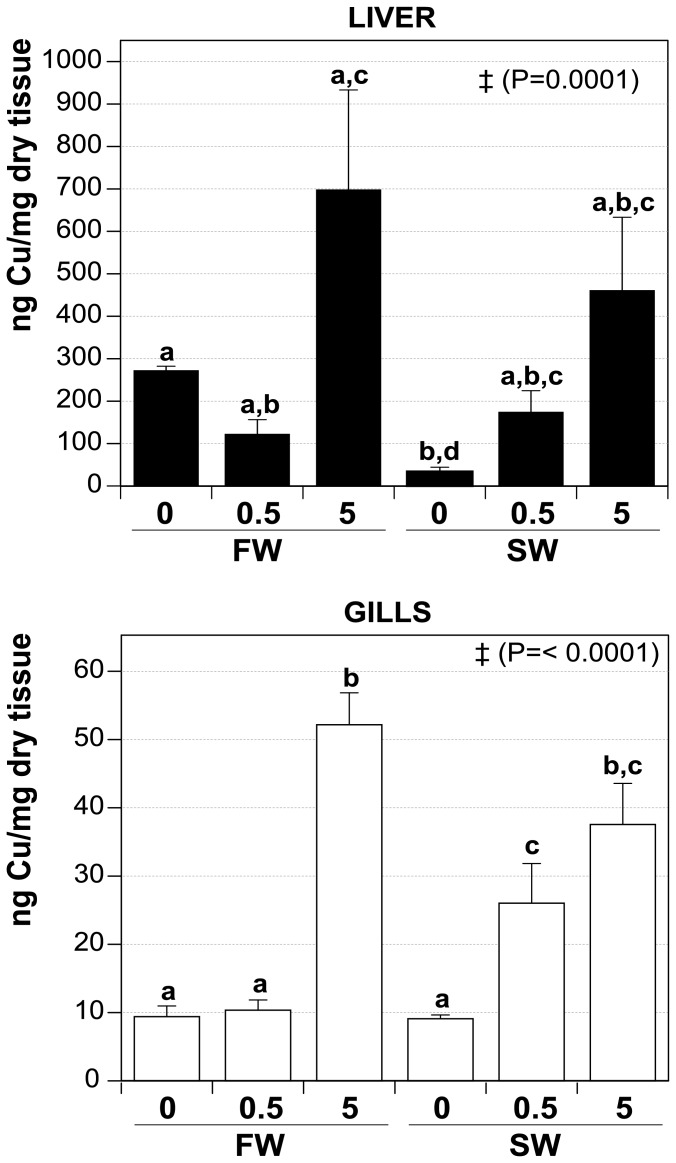
Figure 8. Cu-content of liver and gills after CuO NP exposure at different salinities.
Values (ng of Cu per mg of dry weight) are depicted as mean ± SEM. FW0, fresh water; FW0.5, FW plus 0.5 mg·L−1 CuO; FW5, FW plus 5 mg·L−1 CuO; SW0, increasing salinity; SW0.5, SW plus 0.5 mg·L−1 CuO; SW5, SW plus 5 mg·L−1 CuO. Significant different means by Anova analysis are shown with ‡ (P value). Letters denote groups showing non significant differences by Tukey's post-test (P<0.05). n×treatment = 5.

