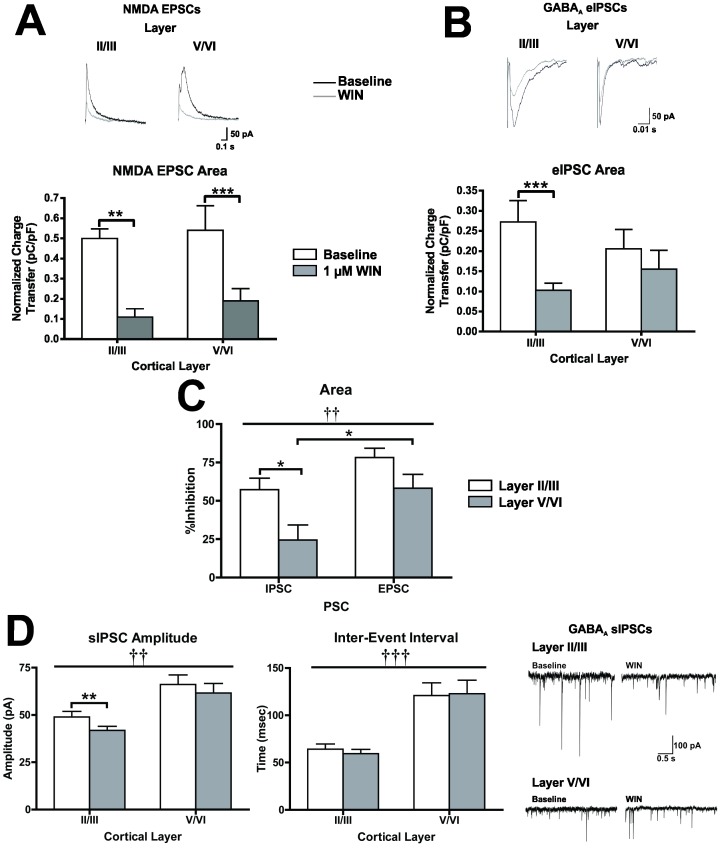
Figure 4. Laminar and synapse specific effects of CB1 activation with 1 µM WIN in organotypic cultures of PFC.
A, Effect of WIN on evoked NMDA EPSCs recorded from layer II/III and layer V/VI PNs (N = 9). B, Effect of WIN on evoked (top graphs) and spontaneous (bottom graphs) GABAA IPSCs recorded from layer II/III and layer V/VI pyramidal neurons (N = 8–11). In panels A and B, white bars represent baseline and grey bars represent PSCs in the presence of WIN. Traces to the right of panels A and B represent example traces from these experiments. For evoked PSCs, black traces represent baseline and grey traces represent PSCs in the presence of WIN. Significant main effects of cortical layer are denoted by a dagger (†) and significant pair-wise comparisons between baseline and WIN are indicated by an asterisks (*). C, comparison of the inhibitory effects of WIN between PSC type and across cortical layers (N = 8–12). White bars represent data from layer II/III PNs and grey bars represent recordings from layer V/VI PNs. Significant main effects of PSC type are denoted by a dagger (†) and significant post-hoc comparisons are indicated by an asterisks (*). For all graphs bars represent mean ± SEM. For all symbols conferring statistical significance: single symbol p<0.05, double symbol p<0.01, triple symbol p<0.001.

