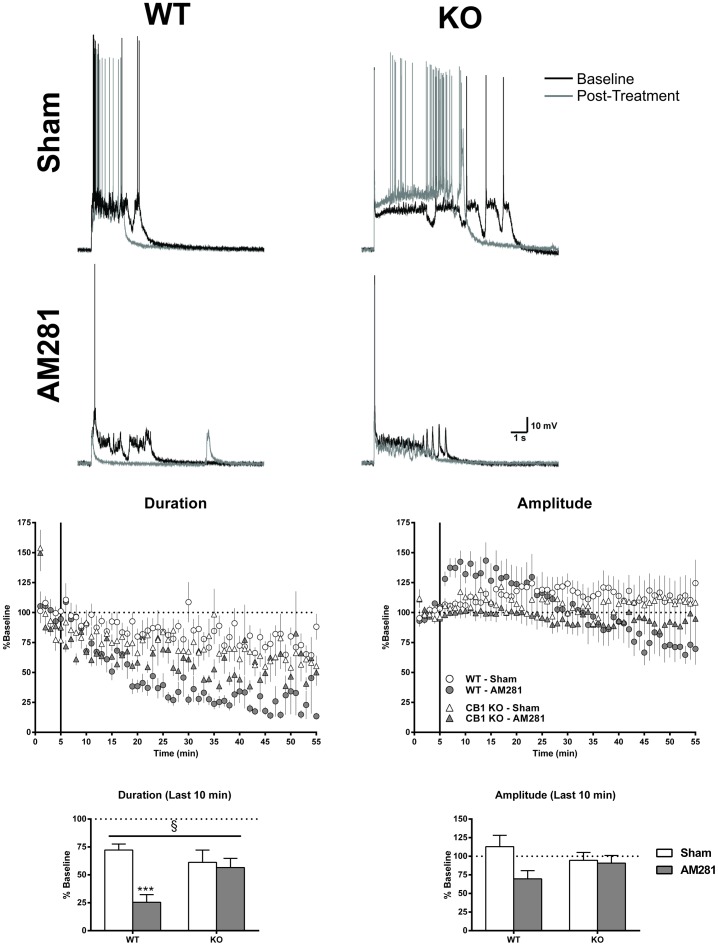
Figure 6. AM281 reduces up-state duration via a CB1-dependent mechanism.
Top panel: example traces from each of the four groups showing baseline up-states (black traces) and those following 50 min of drug application (grey traces). Middle panel: time course of measures of up-state duration and amplitude in wt and CB1 KO cultures under sham conditions or treated with the CB1 inverse agonist AM281 (1 µM). Points are normalized to the pre-drug values for each genotype and represent group means ± SEM (N = 6–11) and. Bottom panel: summary data from the four groups binned over the last 10 min and normalized to their respective baselines (N = 8–10). Bars represent group means ± SEM. Symbols: § - significant interaction (p<0.05), *** - significant post-hoc comparison with wt sham (p<0.001).

