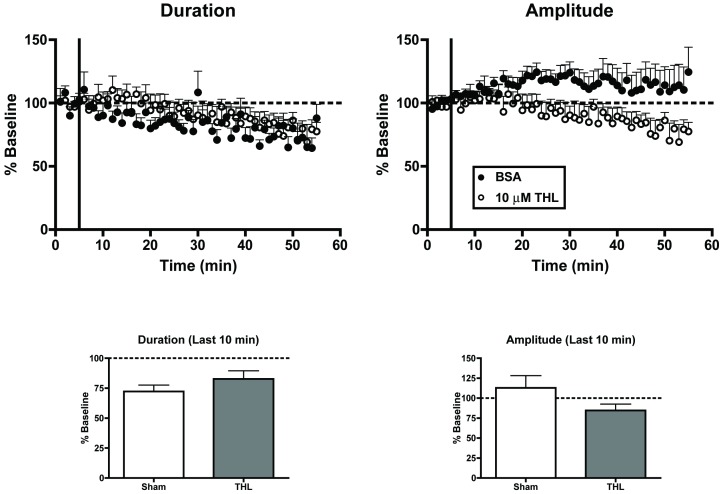
Figure 8. Blockade of 2-AG synthesis does not alter up-state parameters.
Top graphs: time course of measures of up-state duration and amplitude in sham treated cultures and those treated with the DAGL inhibitor tetrahydrolipstatin (THL; 10 µM). Bottom graphs: summary data from the two treatment conditions binned over the last 10 min and normalized to their respective baselines. Bars represent mean ± SEM.

