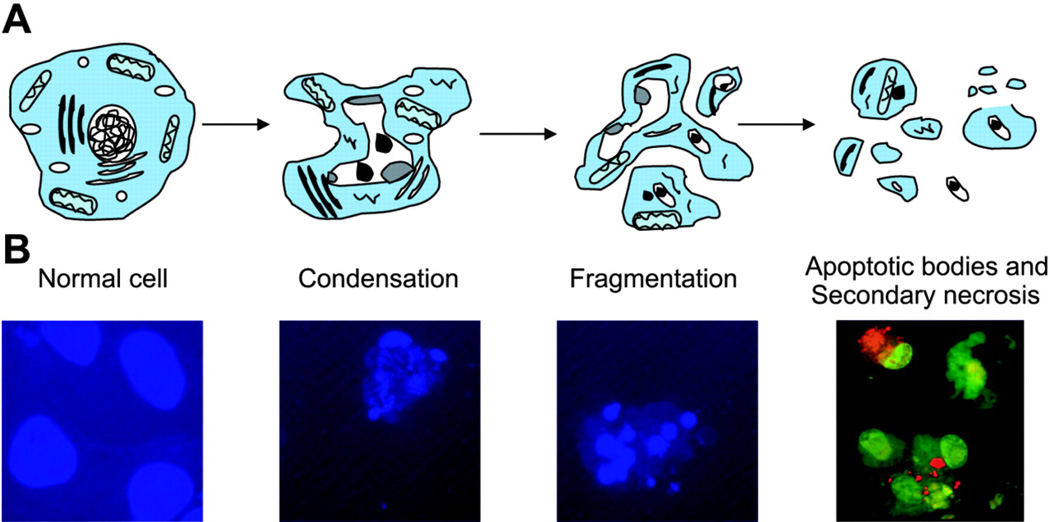
Figure 7. Illustration of the various stages of apoptotic cell death.
A: depiction of the stereotypical changes including condensation, changes in nuclear structure, and fragmentation of the cell into small apoptotic bodies. In vivo, the apoptotic bodies are phagocytosed by neighboring cells, whereas in vitro they undergo swelling and eventual lysis (secondary necrosis). B: photographs of LLC-PK1 cells undergoing apoptosis at the corresponding stages as shown in A. Apoptosis was induced by overnight exposure of the cells to 50 µM cisplatin. The cells in the first 3 photographs were stained with Hoechst dye, and the cells in the last photograph were stained with acrydine orange and ethidium bromide. In the last photograph, viable cells appear green, whereas the apoptotic cells with intact plasma membrane appear green with yellowish dots representing condensed chromatin; apoptotic cells and bodies that are undergoing secondary necrosis appear bright orange or red due to the plasma membrane damage and entry of ethidium bromide. Illustration from citation (415).

