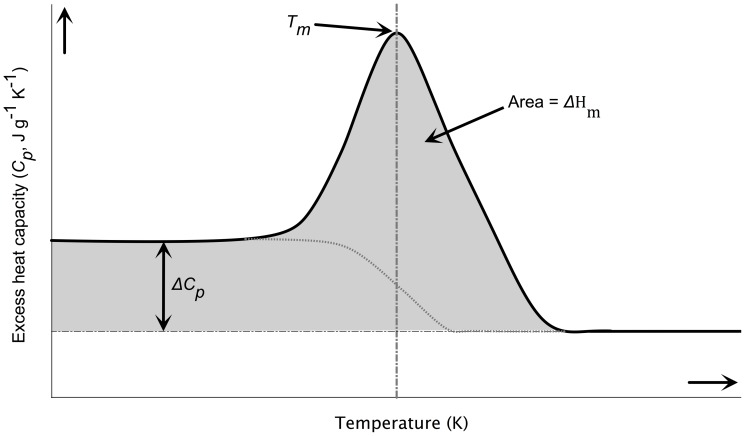
Figure 6. Example of differential scanning calorimetry (DSC) analysis of a PNIPA/AA nanohydrogel aqueous solution.
This figure was adapted from Bruylants et al. [43]. Tm corresponds to the lower critical solution temperature (LCST),  is the enthalpy changes at the midpoint of the collapse transition, i.e., when
  and
and  is the heat capacity change.

