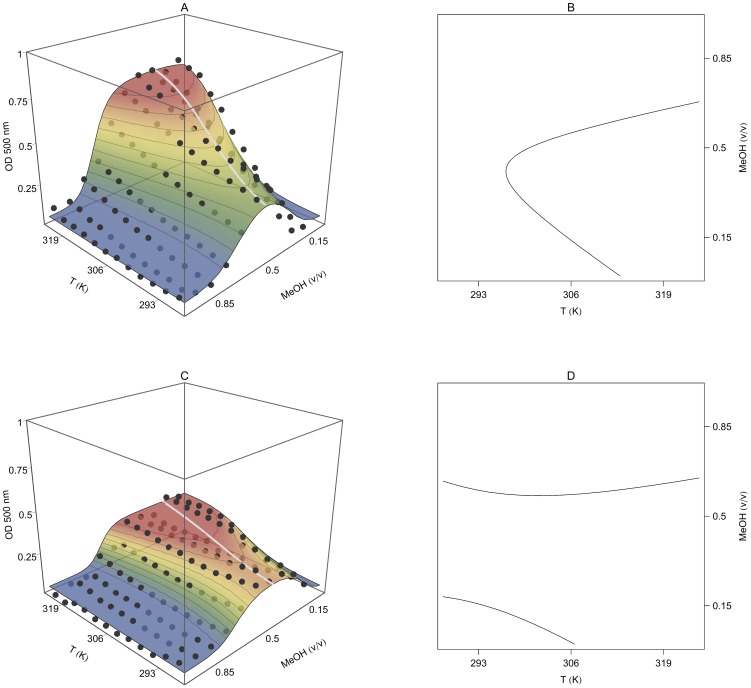
Figure 8. Optical density (OD) variation of PNIPA/AA nanohydrogels as a function of the methanol volume fraction and temperature.
PNIPA(5) (A) and PNIPA-20AA(5) (C) nanohydrogels were previously swelled in distilled water (12.5 mg mL−1) at 25°C. The surface represents the fitting of the experimental data with the Equation 23. Figures B (PNIPA(5)) and D (PNIPA-20AA(5)) show MeOH-T phase diagrams in which the critical line marks the temperature and MeOH conditions at which the nanohydrogel begins to undergo the volume phase transition. The grey line in Figures A and C, calculated with Equation 27, represents the critical methanol concentration at which the tendency in the nanohydrogel collapse changes.

