
Figure 1.
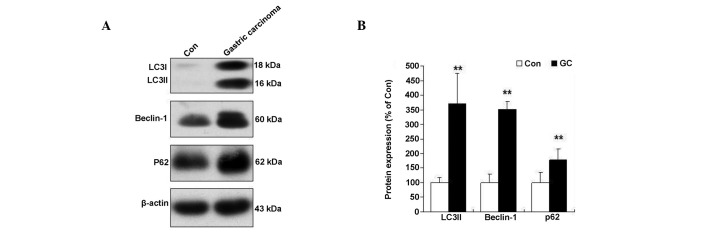
Changes in autophagy signaling molecules in human gastric adenocarcinoma. (A) A representative image showing protein expression of autophagic signaling molecules in human gastric adenocarcinoma using immunoblotting. Proteins were separated by SDS-PAGE and analyzed by immunoblotting with anti-Beclin 1, anti-P62 and anti-LC3 antibodies. (B) Quantitative analysis of protein levels was performed by densitometric analysis of the bands. Immunoblotting with an anti-actin antibody showed equal amounts of loaded protein in each lane. Data are expressed as percentages of control values (mean ± standard deviation; n=5). **P<0.01, vs. control. Con, control; GC, gastric carcinoma; LC3, light chain 3.