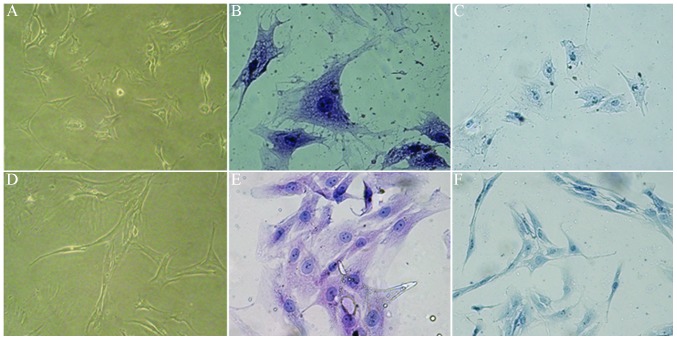
Figure 2.
Morphological changes of the chondrocytes. (A–C) Control group. (D–F) Cervical spondylosis group. (A and D) The morphology of the two groups of chondrocytes cultured for 9 days (magnification, ×40). (B and E) Control group and cervical spondylosis group stained with H&E (magnification, ×100). (C and F) Control group and cervical spondylosis group stained with toluidine blue (magnification, ×100). H&E, hematoxylin-eosin.

