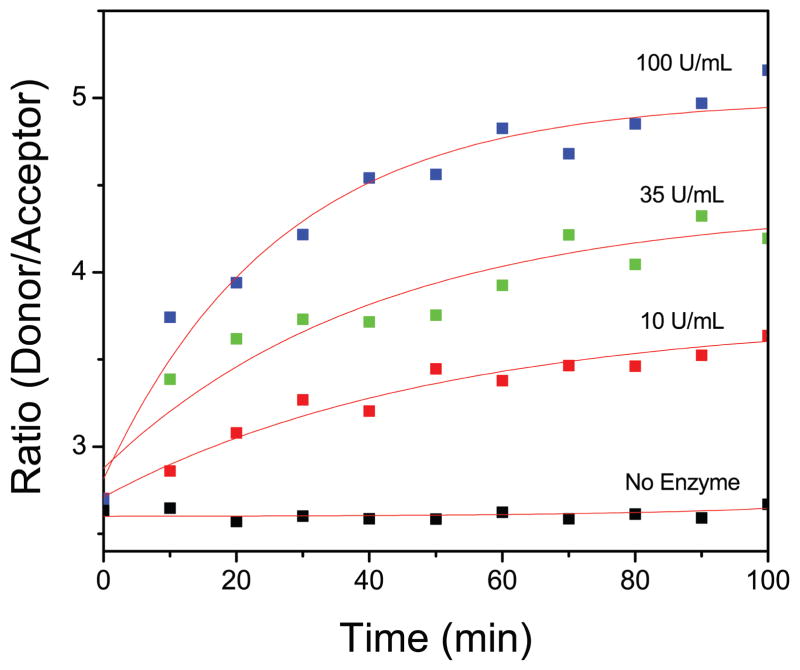
Fig. 4.
Time dependant fluorescence intensity ratio (green/red emission) of HA-FRET probe in the presence and absence of HA-ase and exponential fits (red lines) to data. Concentration of HA-FRET sample was 2 uM in each case. The excitation was 470 nm and experiment was done at RT in synthetic urine pH 7.83.

