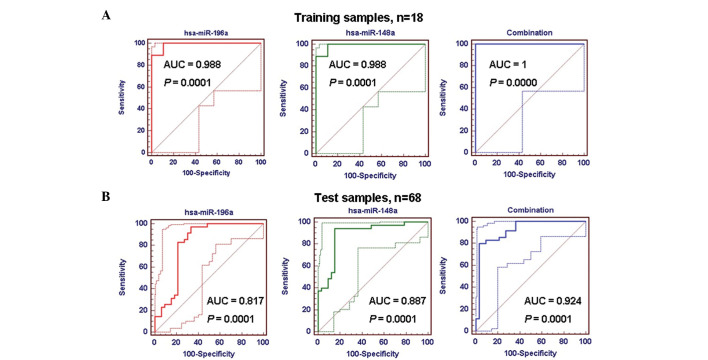
Figure 3.
ROC analyses of the candidate biomarkers. (A) AUC value of the marker (combined hsa-miR-196a and hsa-miR-148a) was 1.0 in the training samples, which was higher than that of hsa-miR-196a or hsa-miR-148a alone. (B) AUC value of the marker was 0.924 in the test samples, which was also higher than that of hsa-miR-196a or hsa-miR-148a alone. This marker was more sensitive and specific for differentiating between the GC and normal samples. ROC, receiver operating characteristic; AUC, area under the curve, miR, microRNA; GC, gastric cancer.

