
Figure 3.
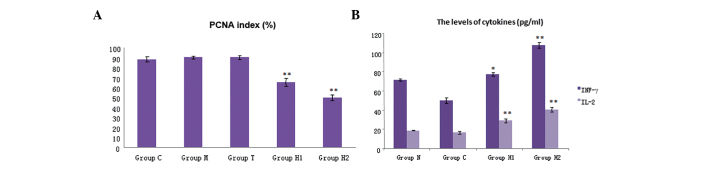
Immunohistochemistry analysis indicated that (A) PCNA expression was decreased significantly in the hyperthermia groups, H1 and H2, compared with that of the control. Compared with groups C, M and T, the PCNA index was significantly decreased (P<0.05). Compared with the H1 group, the PCNA index in the H2 group was significantly decreased (P<0.05). (B) The levels of cytokines in the five groups. IFN-γ and IL-2 were significantly higher in the H1 and H2 groups compared with the three control groups (P<0.05); and there was also a significant difference between the H1 and H2 group (P<0.01). Levels of cytokines, IFN- γ and IL-2, were markedly increased in the H2 group. PCNA, proliferating cell nuclear antigen; IFN-γ, interferon-γ; IL-2, interleukin-2; group C, untreated control; group M, magnetic field control; group T, thermoseed control; group H1, thermoseeds heated to 42–46°C for 30 min; group H2, thermoseeds heated to 50–55°C for 10 min.