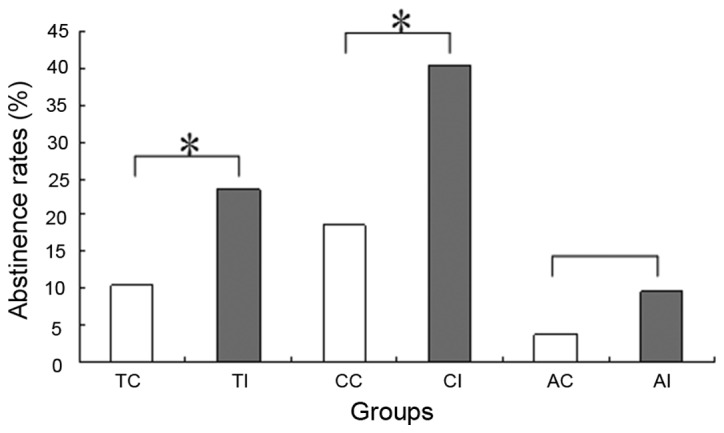
Figure 1.

Abstinence rates in various groups. *P<0.05, as indicated. TC, total smokers control; TI, total smokers intervention; CC, COPD control; CI, COPD intervention; AC, asymptomatic control; AI, asymptomatic intervention; COPD, chronic obstructive pulmonary disease.
