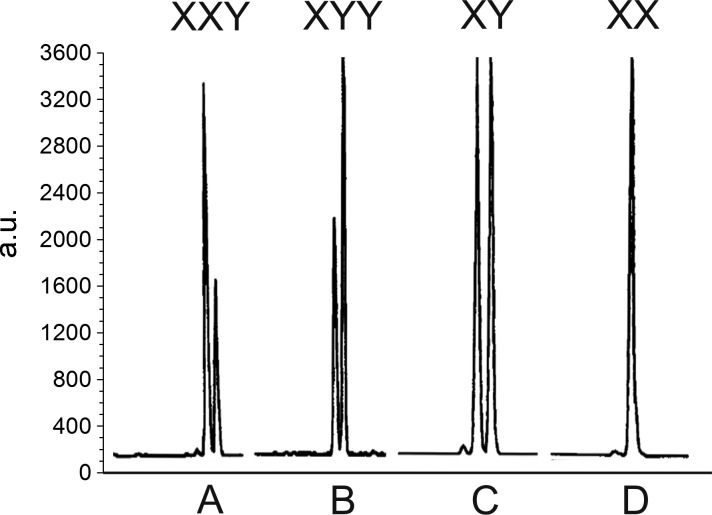
Fig. 3.
Comparison of electrophoretograms of sex test PCR products generated by an ABI Gene Scanner 362A. Primers for “male” and “female” amelogenin genes were employed. A, XXY cell line DNA with 1.8:1 X:Y peak area ratio; B, XYY male with 1:1.8 X:Y peak area ratio; C, normal male DNA with 1.01:1 X:Y peak area ratio; D, normal female (note absence of Y peak). a.u., arbitrary units. [From Sullivan et al. (256) with permission.]

